Our city data dashboard is a unique dataset comparing cities across more than 120 living conditions and health factors that shape residents’ lives, from smoking rates, to sexually transmitted diseases, to chronic diseases, to housing status.
Over the past decade, nearly 67,000 gun deaths occurred in BCHC cities.
About 22 gun deaths occur each day. Two-thirds of these deaths were homicides, and nearly a third were suicides.
Learn more about how these data break down by race and ethnicity, city, and age.
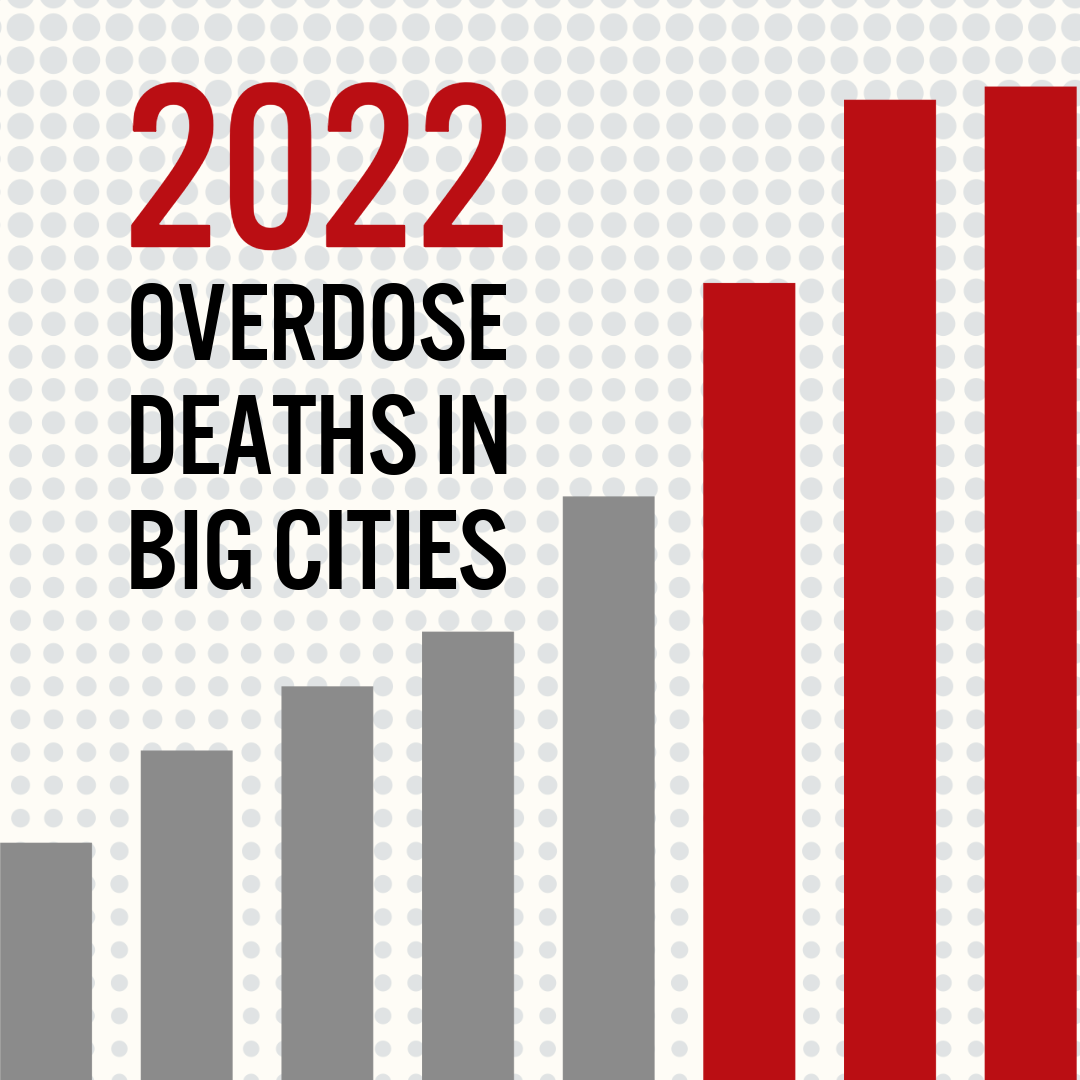
The most recent city-level data show that the alarming increases in drug overdose deaths from 2020 and 2021 have slowed and may be reversing. Big city health departments need stronger support to continue this positive trend by saving lives, addressing racial inequities, and bolstering our communities’ overall well-being and resilience.
To provide the best experiences, we use technologies like cookies to store and/or access device information. Consenting to these technologies will allow us to process data such as browsing behavior or unique IDs on this site. Not consenting or withdrawing consent, may adversely affect certain features and functions.
Functional
Always active
The technical storage or access is strictly necessary for the legitimate purpose of enabling the use of a specific service explicitly requested by the subscriber or user, or for the sole purpose of carrying out the transmission of a communication over an electronic communications network.
Preferences
The technical storage or access is necessary for the legitimate purpose of storing preferences that are not requested by the subscriber or user.
Statistics
The technical storage or access that is used exclusively for statistical purposes.The technical storage or access that is used exclusively for anonymous statistical purposes. Without a subpoena, voluntary compliance on the part of your Internet Service Provider, or additional records from a third party, information stored or retrieved for this purpose alone cannot usually be used to identify you.
Marketing
The technical storage or access is required to create user profiles to send advertising, or to track the user on a website or across several websites for similar marketing purposes.