Frontline Blog
Fresh health data insights on lead poisoning, broadband access, and rent affordability in U.S. cities
May 2025

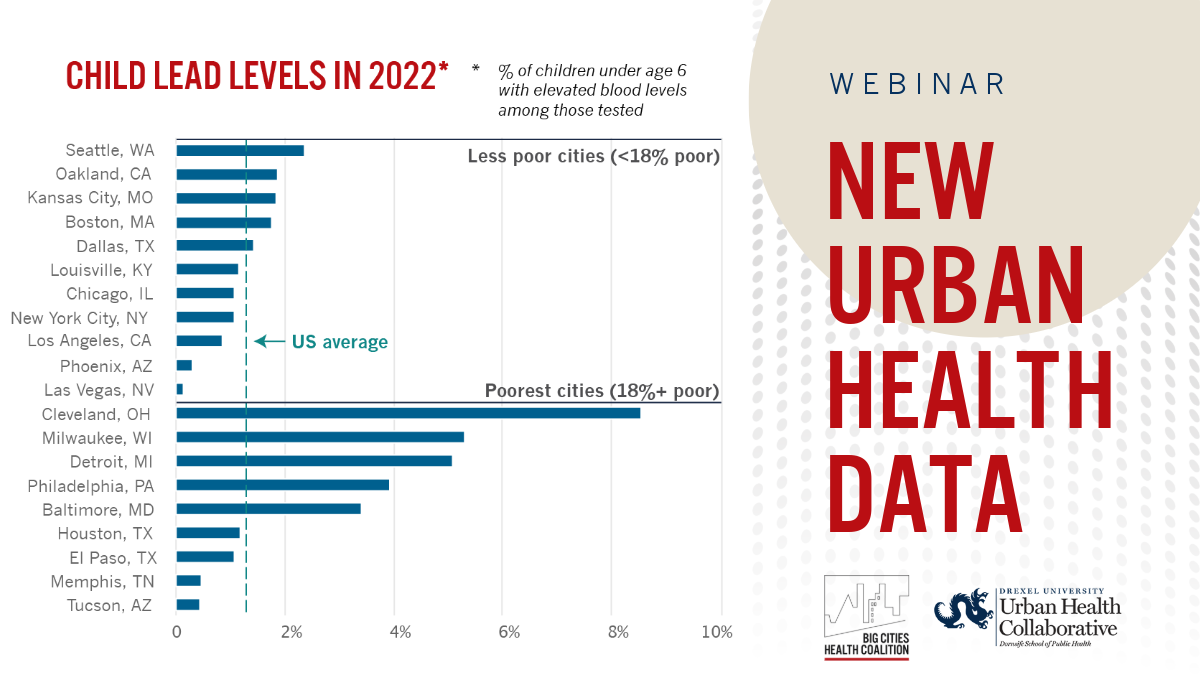
New data and metrics on BCHC’s city data dashboard illuminate important trends in childhood blood lead levels, as well as health-related indicators such as healthy youth development, broadband access, and rent costs.
This Big Cities Health Inventory platform – managed in partnership with the Drexel Urban Health Collaborative (UHC) – includes more than 200,000 data points for over 125 metrics for BCHC’s 35 member cities.
The platform now includes available data for all metrics spanning the years 2010–2023.
Get a guided tour of the city data dashboard
Highlights from the new data and metrics
Platform boasts unique features
The data platform can be used to view health data over time for single cities, as well as to compare metrics across cities, and view racial and ethnic inequities across cities. Data can be downloaded as a CSV file or as single charts.
Compared to other platforms, the BCHI has newer data, three times as many metrics, city-level data, and data for racial and ethnic subgroups. The data – which mostly originates from over 25 federal and state sources – undergoes extensive data processing (harmonization, age-standardization, etc.) and quality checks to ensure comparability across cities and time.
Over the past 12 months, the platform has been used more than 60,000 times including to download data and charts.
The Big Cities Health Inventory data platform is supported by the Centers for Disease Control and Prevention of the U.S. Department of Health and Human Services (HHS) as part of a financial assistance award totaling $500,000 with 100 percent funded by CDC/HHS. The contents are those of the author(s) and do not necessarily represent the official views of, nor an endorsement, by CDC/HHS, or the U.S. Government.